Market Update September 2023

The autumn leaves are transforming the landscape, the beauty of Fall is upon us. For a Burlington real estate agent like myself, this marks an ideal period for property showings – a season that’s neither too scorching nor too frigid. As we embrace the arrival of fall, we’re witnessing a flurry of news reports shedding light on the residential real estate market and the upcoming trends. Let’s take a look at the September market stats reported by the Toronto Regional Real Estate Board, exploring the Market Update within the Greater Toronto Area (GTA) and its neighbouring regions.
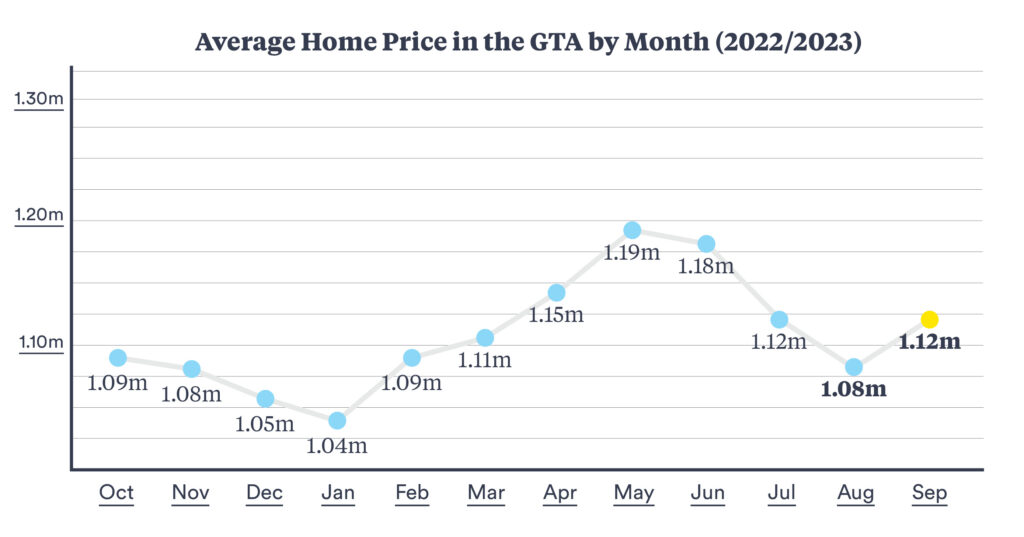
The Toronto Regional Real Estate Board shared that the average price of homes (all types included) went up by 3% compared to last year, even with more houses available for sale and higher borrowing costs. In September, the average price was $1,119,428, which is slightly more than the $1,086,762 reported last year, as stated in the Toronto Real Estate Market Watch report.
Although the average price increased slightly compared to the previous year, the number of homes sold (transactions) reported by TRREB decreased by 7.1%. However, there were about 40% more homes available for sale. To give you a clearer picture, there were 18,912 homes for sale last month compared to 13,529 during the same month last year. The decrease in sales was most noticeable in houses like semi-detached and townhouses, which are ground-oriented dwellings. Even after considering seasonal changes, there was still a small drop in sales when comparing month-to-month numbers.
GTA Real Estate Market Stats
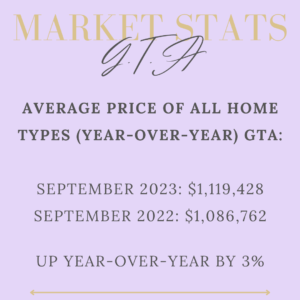
In September 2023, the average selling price (year-to-date) for all types of homes in the Greater Toronto Area (GTA) decreased by 6.6% to $1,133,276 when compared to the same time in 2022. However, when we look at the average year-over-year price, there was a 3% decrease, bringing the average price to $1,119,428. Condo prices in the GTA were down by 3.3% compared to the previous year, with an average price of $707,065 (year-over-year). Condo sales were consistent with 1,307 sales reported.
Toronto Real Estate Market Stats
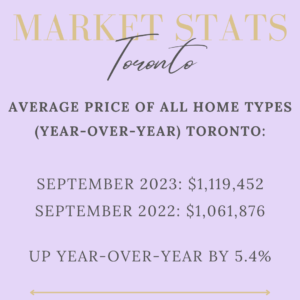
In September 2023, the average selling price (year-to-date) for all types of homes in Toronto decreased by 4.9% to $1,100,770 when compared to the same time in 2022. However, when we look at the average year-over-year price, there was a 5.4% increase, bringing the average price to $1,119,452. Condo prices in Toronto were down by 4.8% compared to the previous year, with an average price of $732,106 (year-over-year). The number of condo sales were down 2.9, with 850 condo sales reported.
Mississauga Real Estate Market Stats
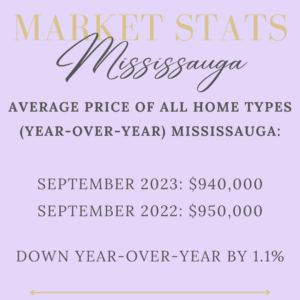
In September 2023, the average selling price (year-to-date) for all types of homes in Mississauga decreased by 6.7% to $1,065,009 when compared to the same time in 2022. However, when we look at the average year-over-year price, there was a 1.1% decrease, bringing the average price to $1,021,324. Condo prices in Mississauga were up by 2.2% compared to the previous year, with an average price of $652,653 (year-over-year). The number of condo sales was down 1.6%, with 122 condo sales reported.
Oakville Real Estate Market Stats
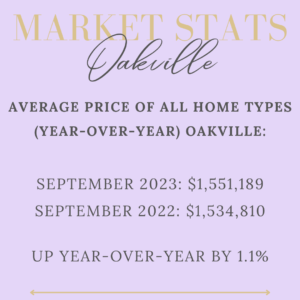
In September 2023, the average selling price (year-to-date) for all types of homes in Oakville decreased by 6.8% to $1,546,424 when compared to the same time in 2022. However, when we look at the average year-over-year price, there was a 1.1% increase, bringing the average price to $1,551,189. Condo prices in Oakville were up by 2.5% compared to the previous year, with an average price of $750,910 (year-over-year). The number of condo sales was down 15.6%.
Milton Real Estate Market Stats
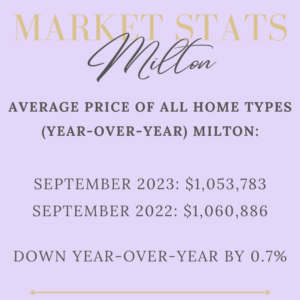
In September 2023, the average selling price (year-to-date) for all types of homes in Milton decreased by 8.1% to $1,096,637 when compared to the same time in 2022. However, when we look at the average year-over-year price, there was a 0.7% decrease, bringing the average price to $1,053,783. Condo prices in Milton were down by 4.2% compared to the previous year, with an average price of $595,556 (year-over-year). The number of condo sales was down 22.2%.
Burlington Real Estate Market Stats
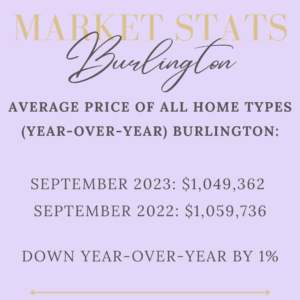
In September 2023, the average selling price (year-to-date) for all types of homes in Burlington decreased by 11.7% to $1,098,149 when compared to the same time in 2022. However, when we look at the average year-over-year price, there was a 1% decrease, bringing the average price to $1,049,362. Condo prices in Burlington were down by 3.8% compared to the previous year, with an average price of $656,808 (year-over-year). The number of condo sales was up 17.6%.
Hamilton Real Estate Market Stats
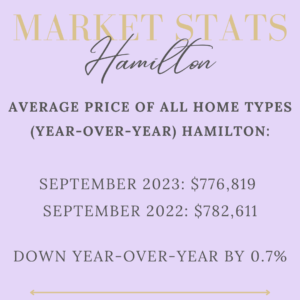
In September 2023, the average selling price (year-to-date) for all types of homes in Hamilton decreased by 11.7% to $ 804,916 when compared to the same time in 2022. However, when we look at the average year-over-year price, there was a 0.7% decrease, bringing the average price to $776,819. Condo prices in Hamilton were down by 2% compared to the previous year, with an average price of $504,638 (year-over-year). The number of condo sales was up 34.5%.
Are you thinking about moving, I am here for you! Check out my process when you buy, sell, or invest. I would love to chat about real estate or even just catch up! Please don’t hesitate to reach out and discuss your goals!
Related Posts

Market Update January 2023
Market Update March 2023